
How does your city rank on climate action?
Explore the interactive map comparing 20 Contra Costa communities on solar & storage, waste, transportation and green power.
Explore the 2025 Climate Scorecard →
Free, interactive map · Scores out of 100 from 2025 public data · Scores by TRACE
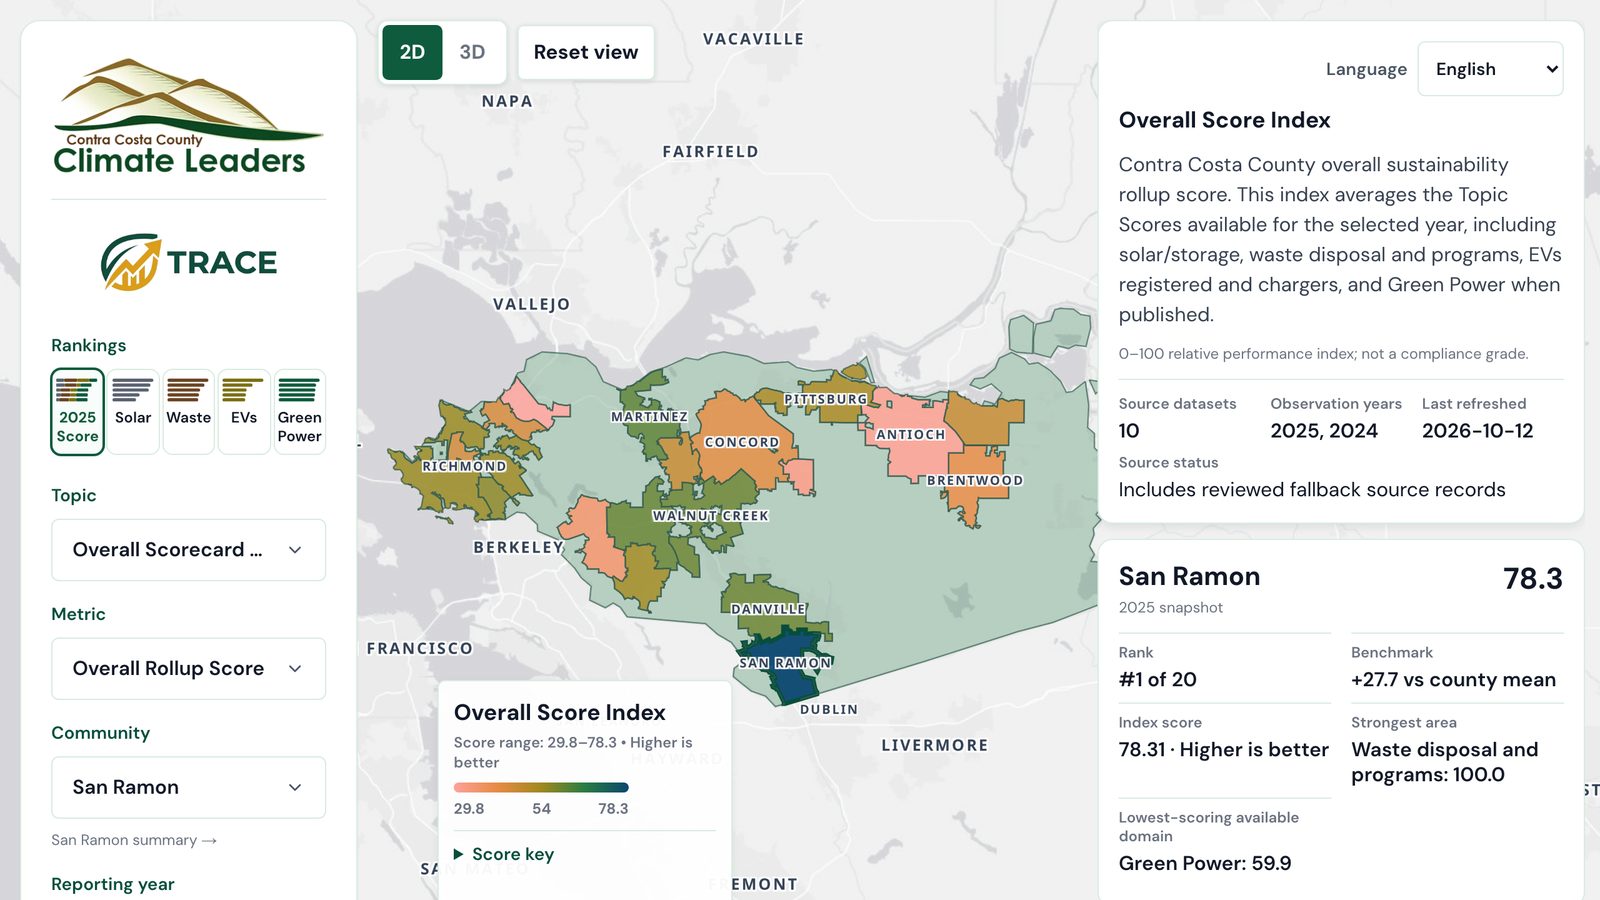
2025 top performers
Or jump straight to your city:
AntiochBrentwoodClaytonConcordDanvilleEl CerritoHerculesLafayetteMartinezMoragaOakleyOrindaPinolePittsburgPleasant HillRichmondSan PabloSan RamonWalnut CreekUnincorporated
Looking for older fact sheets or reports? See the report archives.
4CL Facebook Posts
